GRAPH - CREATE GRAPHS
This is an Optional BSMGR program for Windows users only.
(Call BSMGR if you are interested in purchasing this program.)
The GRAPH program is set up to automatically graph BSMGR information:
You may also go directly into the GRAPH program yourself and create graphs unrelated to these BSMGR programs by entering <GRAPH> in the "Enter Program Name" field and pressing <Enter>.
Before you will be able to graph any figures from the BSMGR programs referred to above, you will need to make some entries in:
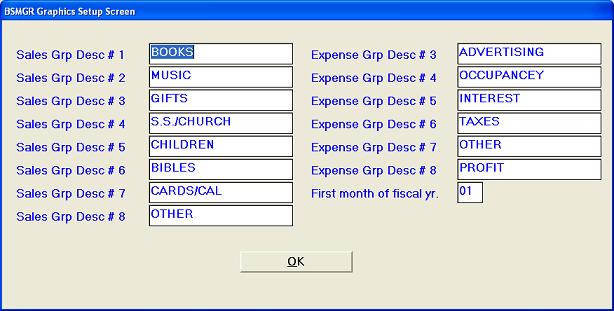
Set up SYStem, Config File, Change Misc. Configurations, number 7046.
- The first eight lines correspond to your sales departments combined into eight groups. (These groups are also used for the codes on the mailing list.) The divisions you enter here will be shown on the graph labels on Income Accounts.
- Expenses are also grouped into eight groups. The first two groups default to "Cost of Goods" and "Salaries" and are not shown. The next six lines correspond to the last six divisions of expenses. These will be shown on the graph labels on Expense Accounts.
- The last line is where you enter the numerical equivalent of the first month of your fiscal year.
Open the GLM program and go into each of your general ledger accounts that are Type "A" (Regular [A]ccounts). (Do not go into the [H]eader or [T]otal Accounts.) (Your Chart of Accounts might be helpful as a reference in identifying the "A" accounts when making these entries.)
In the "Graph Category" field, make the appropriate selections from the list box provided according to the "Account Type."
a. Asset Accounts:
Current Assets Inventory
Plant Assets
When an "Inventory" account category is selected, the "Revenue Dept" field will activate. You may use this to put your inventory into 48 different groups, to associate the inventory account with a revenue department (1-48) within your cash register setup. This allows you to compare inventory with sales.
b. Capital Accounts:
Not Used for Capital
c. Liability Accounts:
Short Term Long Term
d. Income Accounts:
Example: |
||
| Not Used | ||
| Books | ||
| Music | ||
| Gifts | ||
| S.S./Church | ||
| Children | ||
| Bibles | ||
| Cards/Cal | ||
| Other |
The divisions you have set up in your SYStem Config File, Change Misc. Configurations, number 7046 determine the “Income” account graph categories above. (Sales group descriptions.)
e. Expense Accounts:
Example: |
||
| Not Used | ||
| Cost of Goods | ||
| Salaries | ||
| Advertising | ||
| Occupancy | ||
| Interest | ||
| Taxes | ||
| Other | ||
| Profit |
The first two expense account graph categories default to "Cost of Goods" and "Salaries." The divisions you enter on your SYStem Config File, Change Misc. Configurations, number 7046 determine the other six. (Expense group descriptions.)
GRAPH EXAMPLE
There are five graph/chart choices:
Pie Chart
Bar Graph
Stacked Bar Graph
Line Graph
Point Graph.
The illustration above is a "Stacked Bar Graph."
This option allows you to display all subsets on one graph or each subset on a separate graph. For example, when comparing sales totals in SLA, each year can be displayed separately or all together.
Clears and rereads all graph/chart information and will then redisplay to the screen.
This option allows you to enlarge the graph to fill the entire screen.
Prints as set up on the printer that has been determined to be the default printer.
This option allows you to change the printer and print setup.
Select Close to return to the previous screen, where you may select the information and the period for another graph, if so desired.
______________________________________________________________________________________
BOOKSTORE MANAGER AUTOMATIC GRAPHING
A. SLE - To graph your sales by the day.
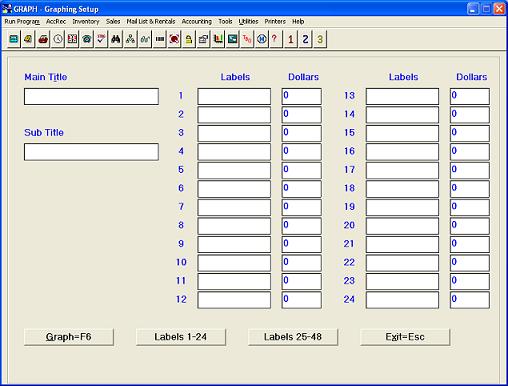
Run the SLE program and press F6-Graph to bring up the Graphing Setup screen.
Main Title and Sub Title
You may choose a title and a sub title for the graph.
Labels
The "Labels" columns will already be filled in with the 48 cash register departments. You may delete any of the department labels that you do not need to show up on the graph.
Dollars
The sales amounts will be filled in for that day.
Graph=F6
Select Graph=F6 to preview the graph.
B. SLT - To graph sales by the month.
Run the SLT program and select F6-Graph to bring up the Graphing Setup screen.
The graphing procedure is the same as explained in SLE above.
C. SLA – To compare sales totals for as many as 5 years.
Run the SLA program, selecting "Graph" in the "Send To" field. Press <OK>.
The graph will be titled "Sales Journal Analysis" and will indicate the sales comparison you have chosen.
D. GLGR - To graph figures in your General Ledger.
Open the GLGR program and enter the month (1-12) you want to graph. Select OK to bring up the General Ledger Graphics screen.
Select the general ledger "Information" you want to graph and the "Period" you want.
Select F6=Graph to preview the graph.
E. IVT - To graph your Inventory.
Run the IVT program according to the type of inventory report you want to graph. Select Graph=F6 to bring up the Graphing Setup screen.
The graphing procedure is the same as explained in SLE above.
When you open the GRAPH program, the Graphing Setup screen will be the same as shown in SLE above, except all fields will be blank.
You may customize the graph with any information of your choice; otherwise, the graphing procedure is the same as explained in SLE above.